

Understanding stock charts and the data they provide can be overwhelming for new investors. However, with some guidance, these charts can be valuable tools in identifying potential investment opportunities during your research process.
By mastering the basics of reading stock charts, you can efficiently analyze new stock prospects and determine which investments warrant further investigation.
Here is a beginner’s guide to interpreting stock charts.
How to Interpret Stock Charts
Stock charts may vary depending on the platform you use to access them. While many financial websites offer free stock charts, you can also find them through your online brokerage account.
For example, the chart below is from Google Finance:
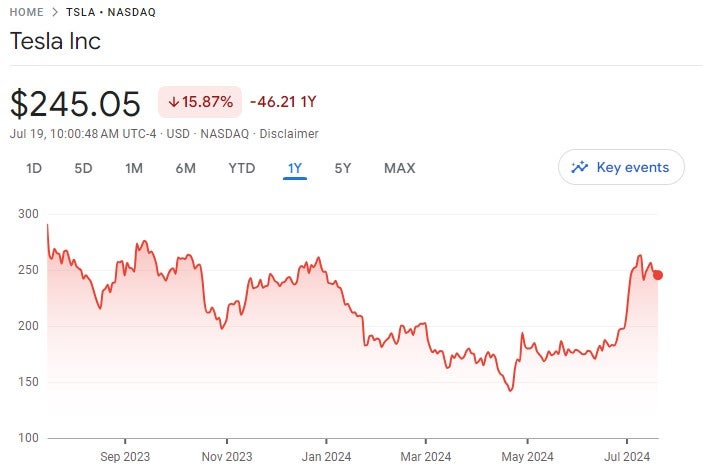
The Stock Chart
Examining a stock chart is a simple way to gauge a stock’s price performance over a specific period. With price per share on the y-axis and time on the x-axis, you can easily track the stock’s trading history. The chart allows you to select different time frames for analysis.
The large number in the top left corner represents the current price per share ($245.05). Adjacent to it, you can see the stock’s price change over the selected period. In this case, Tesla has declined by $46.21, or nearly 16 percent, in the past year.
A notable feature of Google Finance charts is that the chart line changes color (green or red) to reflect the stock’s performance during the selected period. As seen in the example, Tesla’s stock decreased over the previous 12 months, resulting in a red chart line.
Reviewing the long-term price chart provides insight into the underlying business’s performance. While stock prices can fluctuate in the short term, they typically mirror the company’s overall performance over time.
Key Stock Chart Data
Stock charts are accompanied by relevant data that can aid in your analysis. Here are definitions of common stock market terms:
- Open: The price at which the stock opened for trading on a specific day.
- High/Low: The highest and lowest prices at which the stock traded during the day.
- Market Cap: The company’s market capitalization, representing the total value of all outstanding shares.
- P/E Ratio: A valuation ratio comparing the stock price to the company’s annual earnings, helping investors assess the stock’s valuation.
- Dividend Yield: Calculated by dividing the annual dividend per share by the current share price, indicating the return on investment through dividends.
- 52-Week High/Low: The highest and lowest prices the stock has reached in the past year, offering insights into stock performance.
Additional Stock Market Terminology
Stock charts may include other terms that can enhance your understanding of a company’s performance. Here are some terms you might encounter:
- Volume/Average Volume: The number of shares traded in a day, with average volume indicating the typical daily trading volume over a specified period.
- EPS: Earnings per share, reflecting a company’s profit per share.
- Ex-Dividend Date: The deadline for owning shares to receive the next dividend payment.
- Beta: A value used to measure a stock’s volatility compared to the overall market, helping investors assess risk.
- One-Year Target Estimate: An estimate of the stock price in one year, based on analyst projections.
Conclusion
Stock charts and the accompanying data can be valuable resources in your investment research. Once you grasp the fundamentals, you can quickly analyze various charts and glean essential information.
While stock charts highlight price volatility in the short term, remember that a stock’s long-term performance is closely tied to the underlying company’s earnings and cash flow. Ultimately, a stock’s success hinges on the strength of the business itself.
Editorial Disclaimer: Investors are encouraged to conduct their own research on investment strategies before making decisions. Past performance does not guarantee future price appreciation.